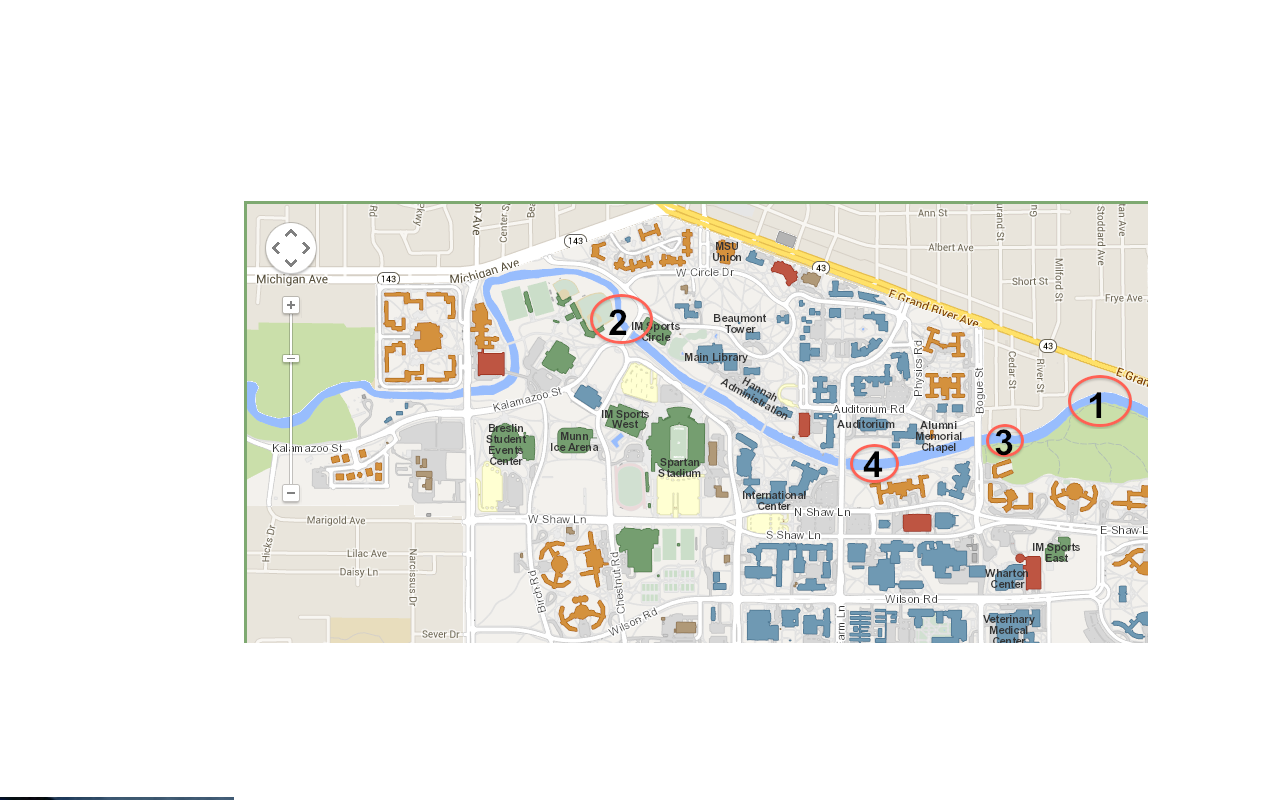
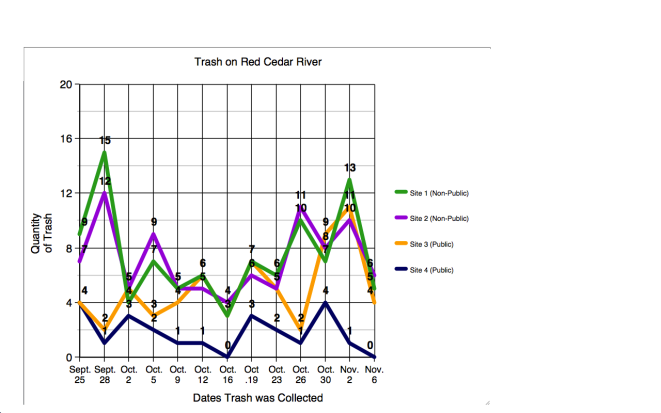
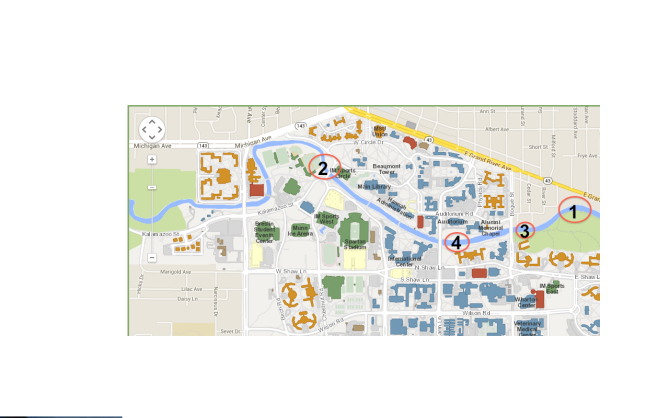
My individual experiment aimed at mapping the distribution of trash along the Red Cedar River and analyzing the data to see if it follows any particular pattern or regimen. In order to do so, I collected trash from 4 very different sites across the Red Cedar River. Of the 4 sites, 2 of which (Sites 3 & 4) are on campus and frequently visited by the public, while the other two (Sites 1 & 2) are far more secluded from the public sphere. I collected data from the sites, which is merely fancy terminology for “picked up trash”, every Thursday and Sunday from September 25-November 6 and recorded the results afterwards. After all the data was gathered, I transformed the information into a couple different graphs and began extracting conclusions. Here is what I found.
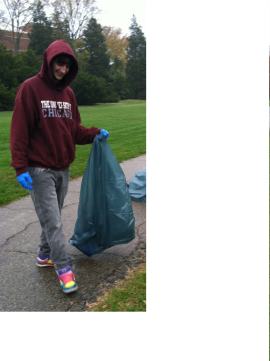
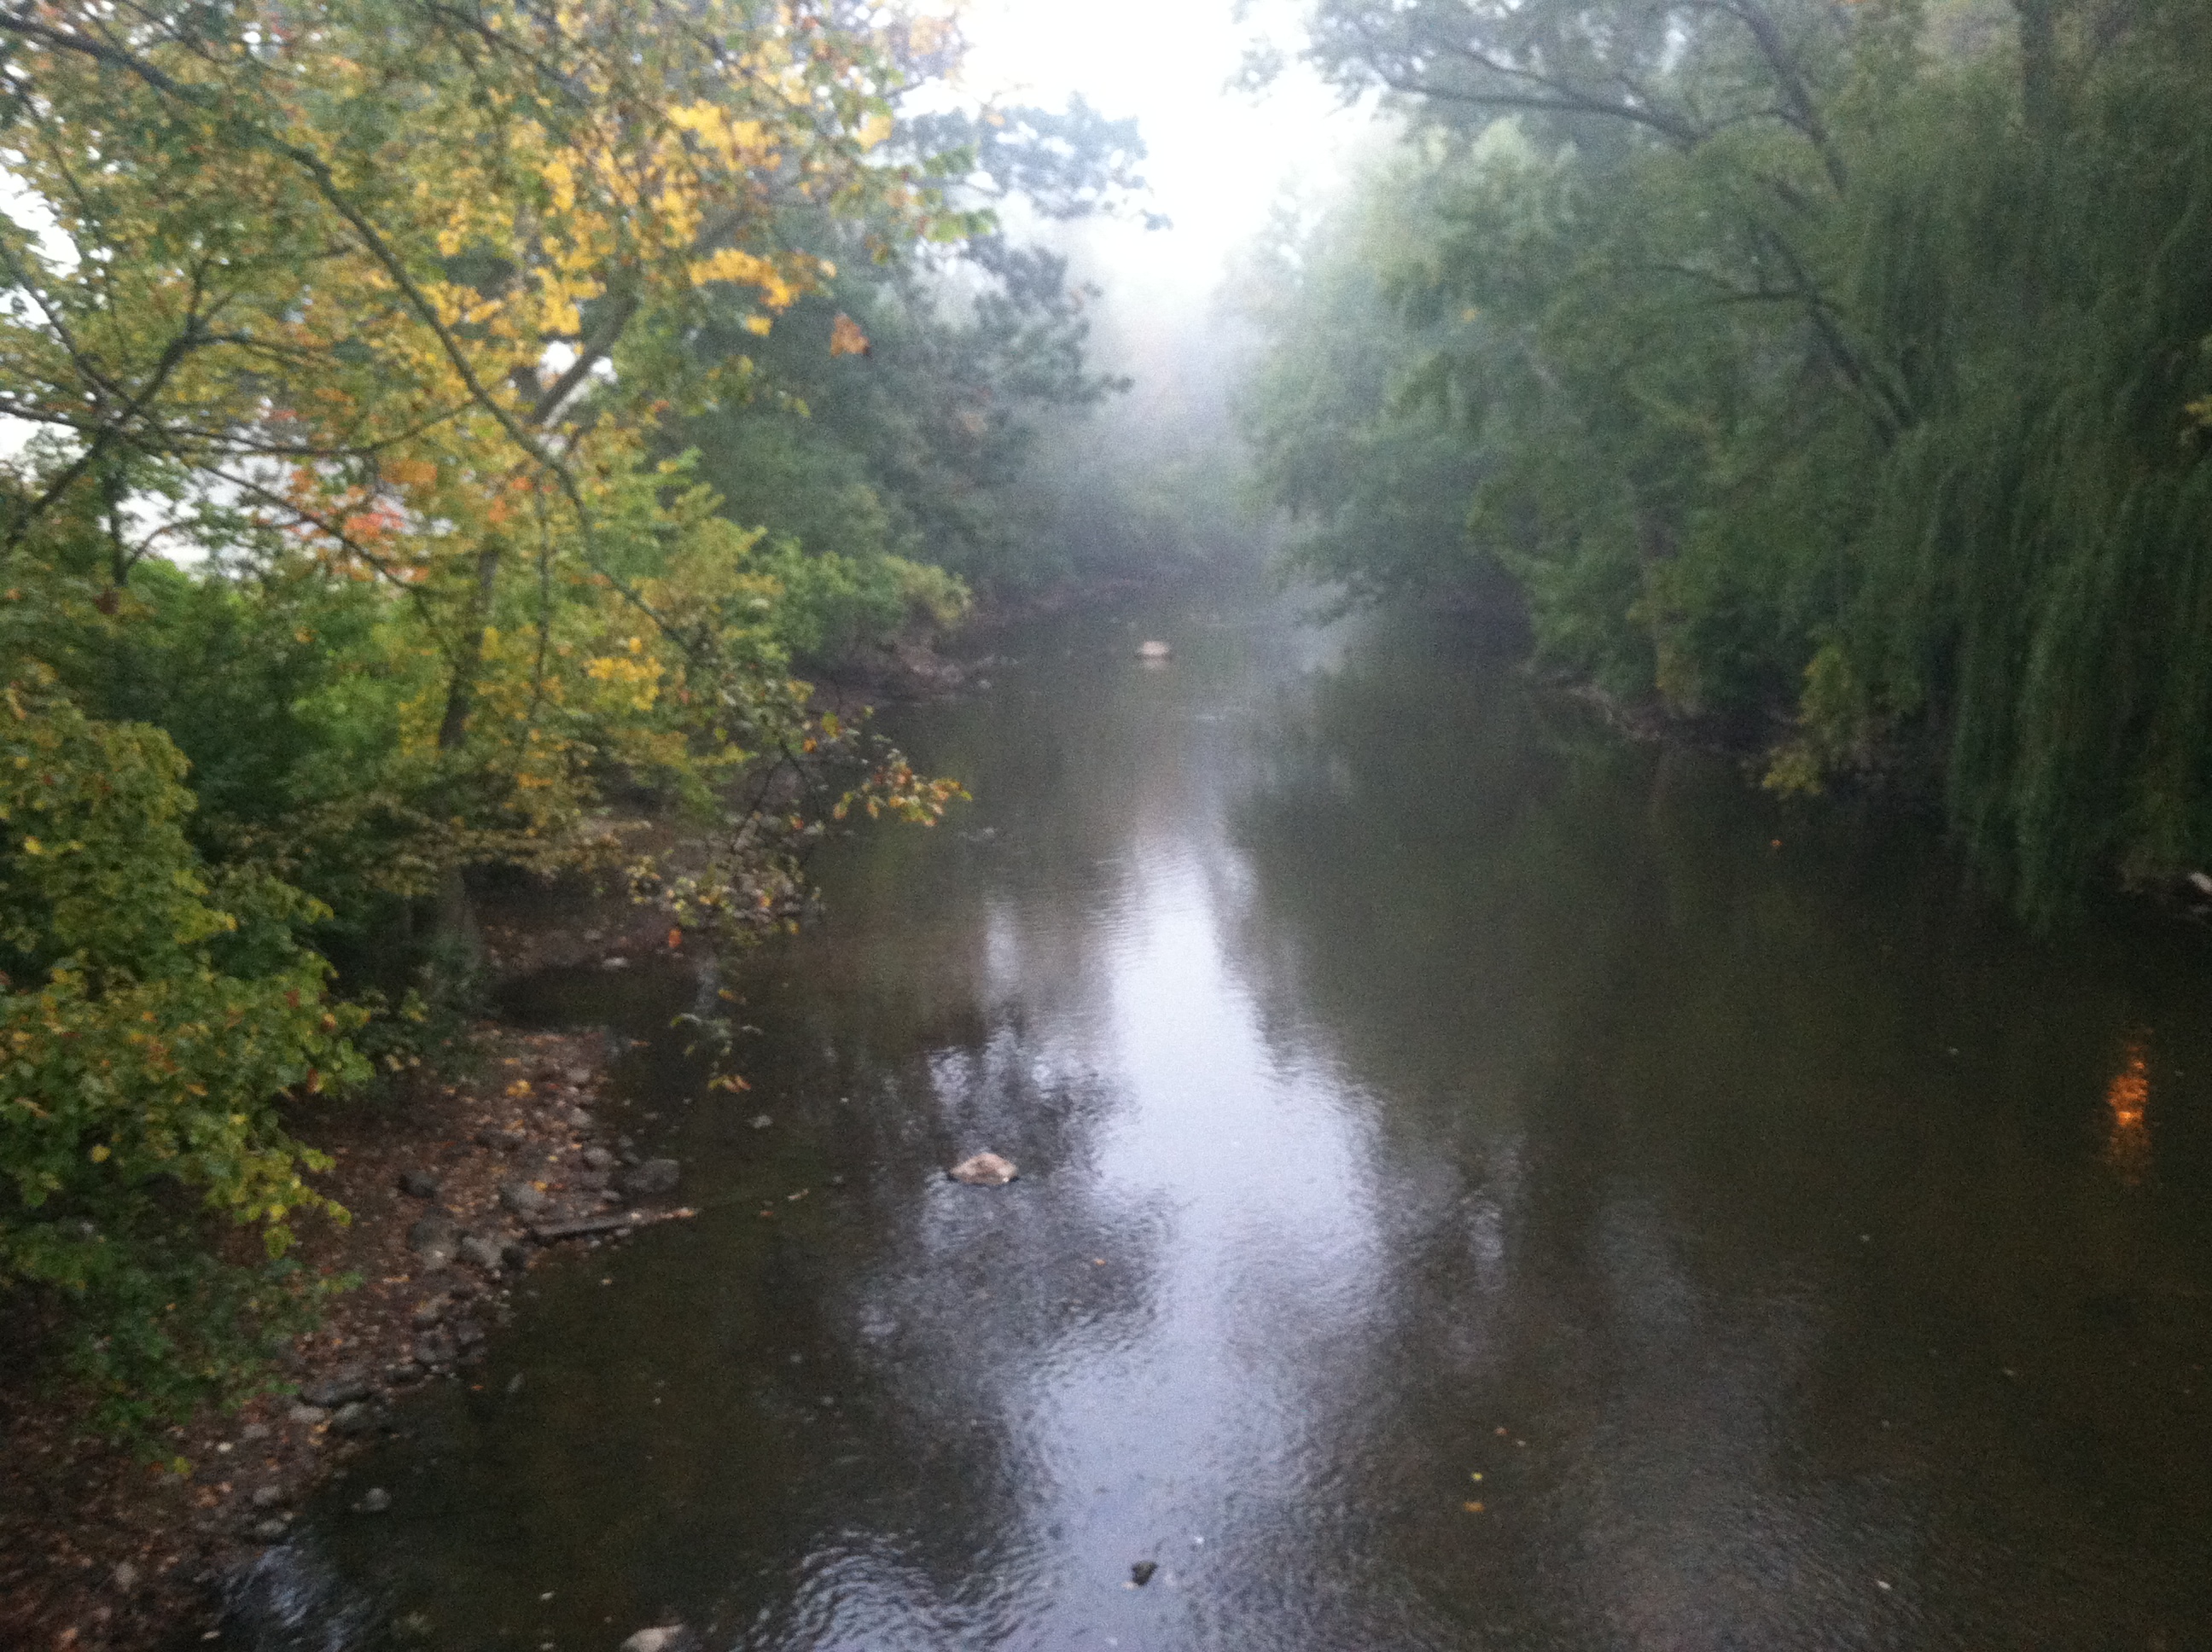
I’m collecting data on one rainy day Thursday. Great hoodie but I am forever a Spartan!
Prior to the collection of any data, I thought the amount of trash would undoubtedly be highest in areas with the greatest concentration of human activity. Furthermore, I believed the amount of trash across all the sites would increase on days which saw an increase in the overall population on campus. Whether it be a home football game, weekend festivity, or heralded weekday conference, I assumed that higher human activity was always in correlation with a larger sum of trash pollution. After examining the data, however, it was apparent that such an assumption was unwarranted.
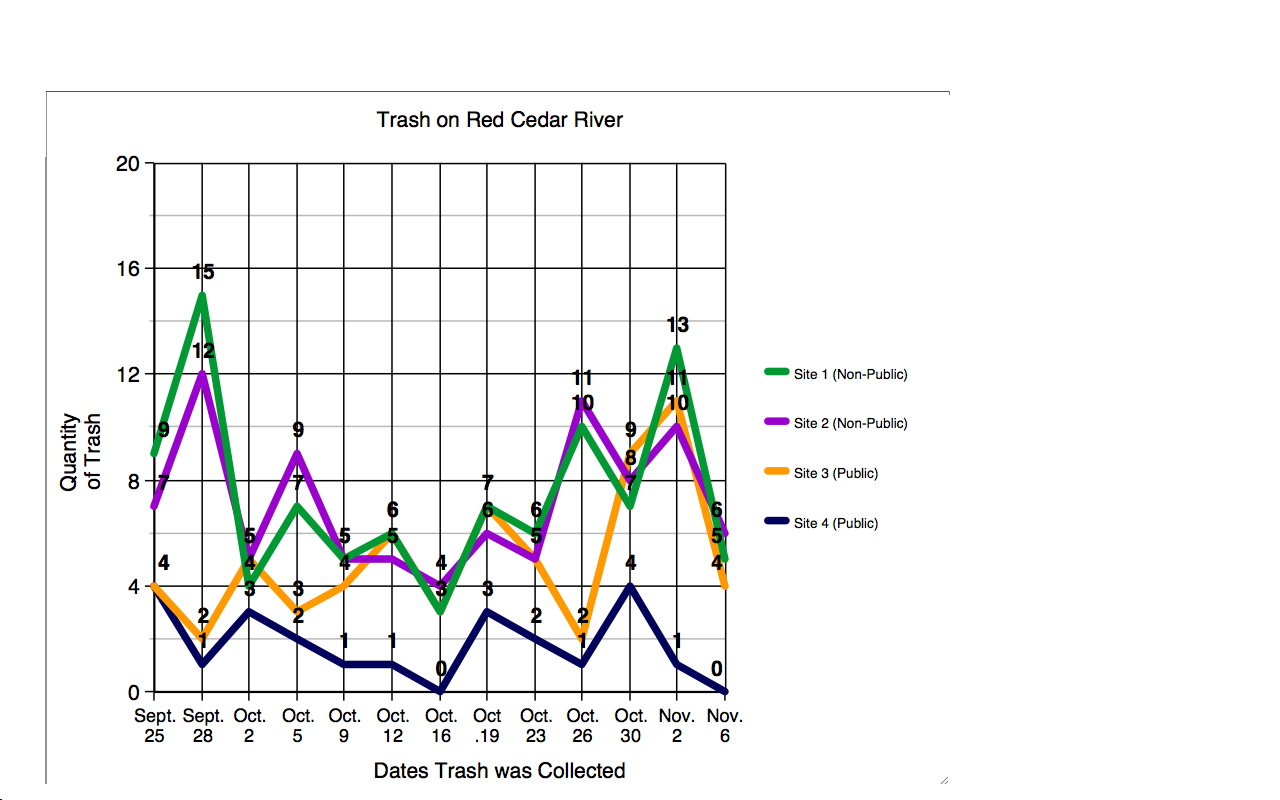
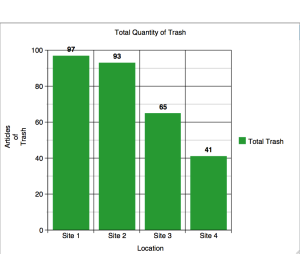
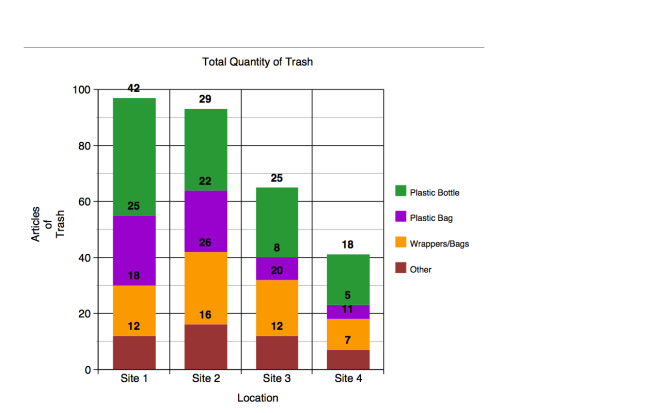
In total, through the duration of the experiment, the sites that were more secluded from the public surprisingly accumulated considerably more trash than more public sites which routinely see frequent human activity. As displayed in the graph below, Site 3 and Site 4, the two public sites, combined for a total of 106 articles of trash while the secluded sites totaled a staggering 200 pieces of trash. Initially, such findings left me dumbfounded. Yet, after considering a multitude of potential reasons, I ultimately think there are a few plausible explanations as to why more human activity does not necessarily equate to greater trash pollution.
Foremost, after examining the data it’s apparent that, in terms of trash pollution, volume of trash is not nearly as important as it’s mitigation and management. In other words, areas on campus are able to sustainably support even the highest levels of human activity if proper forms of waste management are put into place. In regards to my experiment, even though the more public spots (Sites 1 and 2) saw far more people and articles of trash throughout the week, MSU’s efforts to preserve the two areas neutralized any apparent negative ramifications. Variables such as employees hired by MSU or DTN to pick up trash and far better waste management resources are two variables that, what I believe, led to the public sites being far cleaner. While an assortment of trash and recycling options lie throughout Sites 3 and 4, there is not even a trash can near Site 1 or 2. It is as if the lack of waste management options, in terms of trash pollution, for natural but secluded areas around campus leave people who use those resources with no other options but to litter and the results reflect that.
While the conscious effort to assure a clean campus is undoubtedly necessary and admirable, it certainly comes at a cost. The primary drawback of such an approach is that while public areas around the river are clean, the secluded areas are now harboring more waste. Significant when considering the secluded areas home a far vaster array of wildlife. While a dirty campus may not look appealing, a dirty habitat for animals can often result in their death.
I believe another key variable in understanding the differences in trash distribution resides in the location of the four sites relative to the river. Site 2, for example, is located right on a bend of the river, which, augmented with the rigidity of the surface, lead to a almost trapping effect of the trash. Instead of floating down the river, as trash does in most spots, I contend trash got caught in the bend amongst the many rocks and rough terrain. Again, whether it be a product of flowing down river or littering, if the spot is not located directly on campus there is likely no convenient way to mitigate one’s waste.
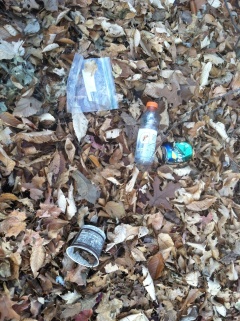
Moreover, the total amount of trash was not the only difference amongst public and private sites. The kind of waste found in the areas around campus differed from each other as well. While plastic bottles such as Gatorade bottles, plastic soda bottles, and water bottles remained the most common article found throughout all the sites, other kinds of trash differed rather significantly. As shown in the graph below, Site 1 and Site 2 also had far more Plastic Bags. Examples of plastic bags found include grocery bags, plastic Ziploc bags of all sizes, and some plastic food wrappers. Also, I just wanted to clarify that the “Other” category is vague to account for the incredibly diverse articles of trash that may only come around once in the experiment. For example, lighters, USB cords, and cooking appliances have all been found throughout the sites.
In total, my findings undermine my hypothesis. Contrary to my initial belief, greater human activity does not result in more trash pollution, but rather a poorer way of managing and mitigating that waste does. Sites 3 and 4 saw far more human activity, yet accumulated far less trash pollution throughout the experiment. As a solution to the growing amount of trash in naturally secluded areas, the remedy, at least to me, is somewhat cut-and-dry. If we managed the natural areas with the same care that we handled the public sphere, I seriously doubt trash pollution would be a problem on our campus at all.
In duplicating my experiment, I would encourage one to consider more variables when picking their sites. The location of the site relative to the River was something I overlooked when choosing Site 2, and such an error could have been the reason why both the secluded areas both totaled so much more trash. At any rate, this experiment revealed to me the that the true cleanliness of our beloved campus lies far beyond that of what we see walking to class. I challenge myself, my university, and you the reader to focus on cleaning and preserving areas dont only make us seem clean, but rather help support our ecosystem as a whole.